GIS Examples
Throughout my time at University as well as my internship, using GIS
was a near daily task. Finding ways to take complex data and show it in
a way that makes sense and is visually appealing, is a challenge I enjoy.
was a near daily task. Finding ways to take complex data and show it in
a way that makes sense and is visually appealing, is a challenge I enjoy.
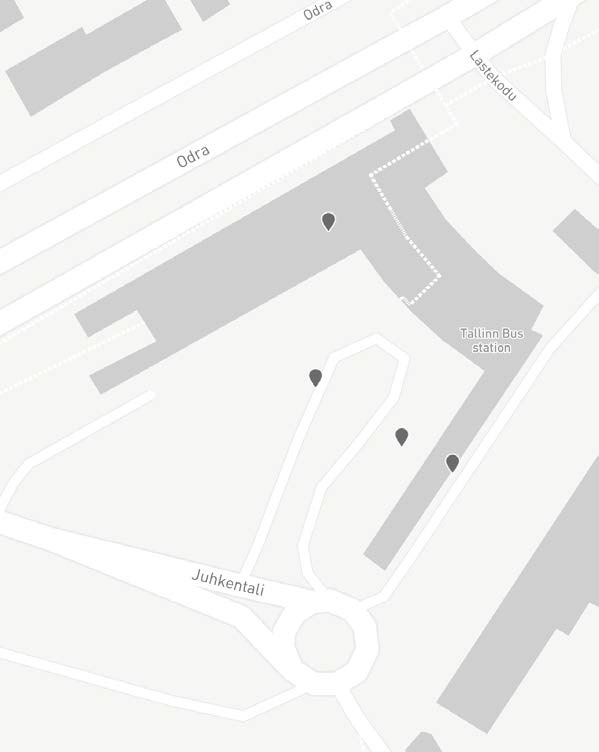
Group work with the Estonian Academy of the
Arts. We documented street- level activity for analysis of public spaces. Collected data regarding the activities of transit users at various locations. Presented final analysis, with GIS maps, and findings from the research.
Arts. We documented street- level activity for analysis of public spaces. Collected data regarding the activities of transit users at various locations. Presented final analysis, with GIS maps, and findings from the research.
The purpose of this project analyze the patterns of increasing extreme heat days, and to see what populations will be affected. After looking at the data, policy recommendations and design interventions were developed.
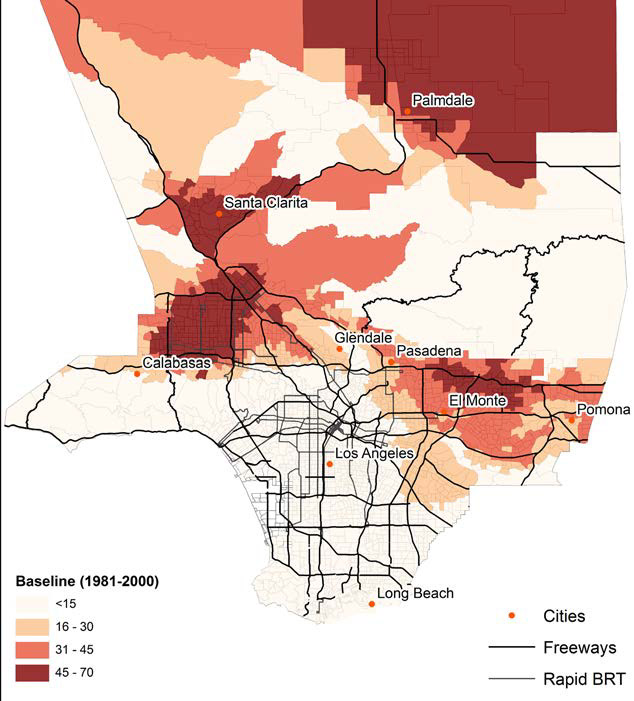
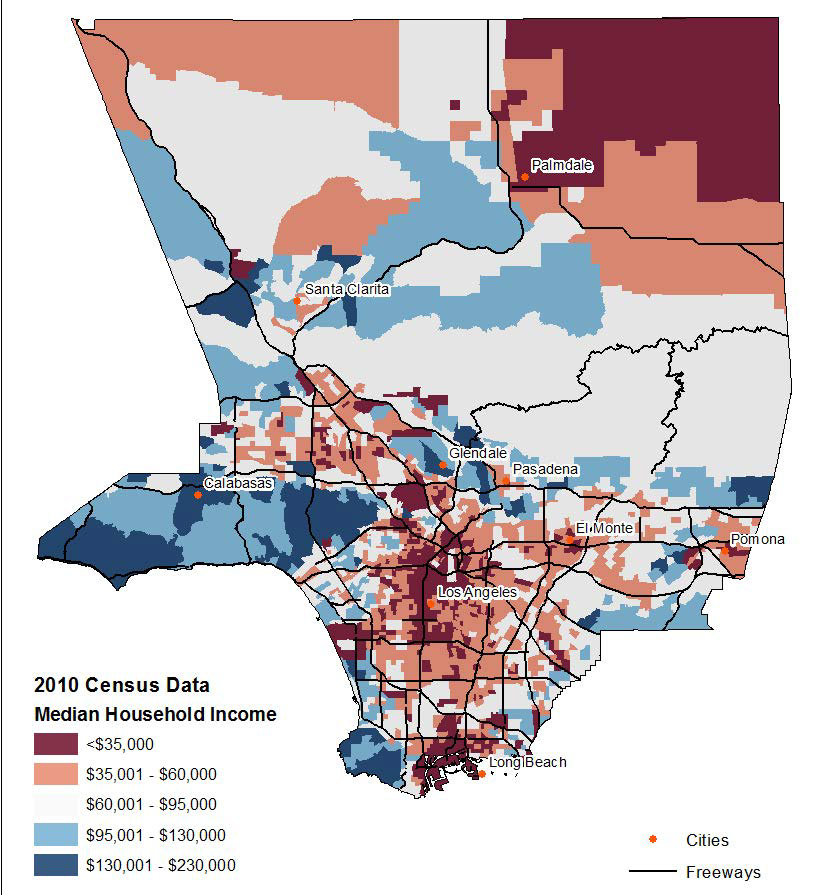
Findings show that the number of extreme heat days are increasing for Los Angeles County. This will have a negative effect on the quality of life and can be dangerous for citizens, especially those with lower incomes who may not be able to afford the increased utilities costs of living in extreme heat.