Independent Research
In Kansas City, there are 41 bicycle sharing stations located throughout the city. The Bicycle sharing stations are operated by BikeWalkKC, a non-profit organization that promotes equity, inclusion and diversity, through the use of various methods, including cycling advocacy and operating the
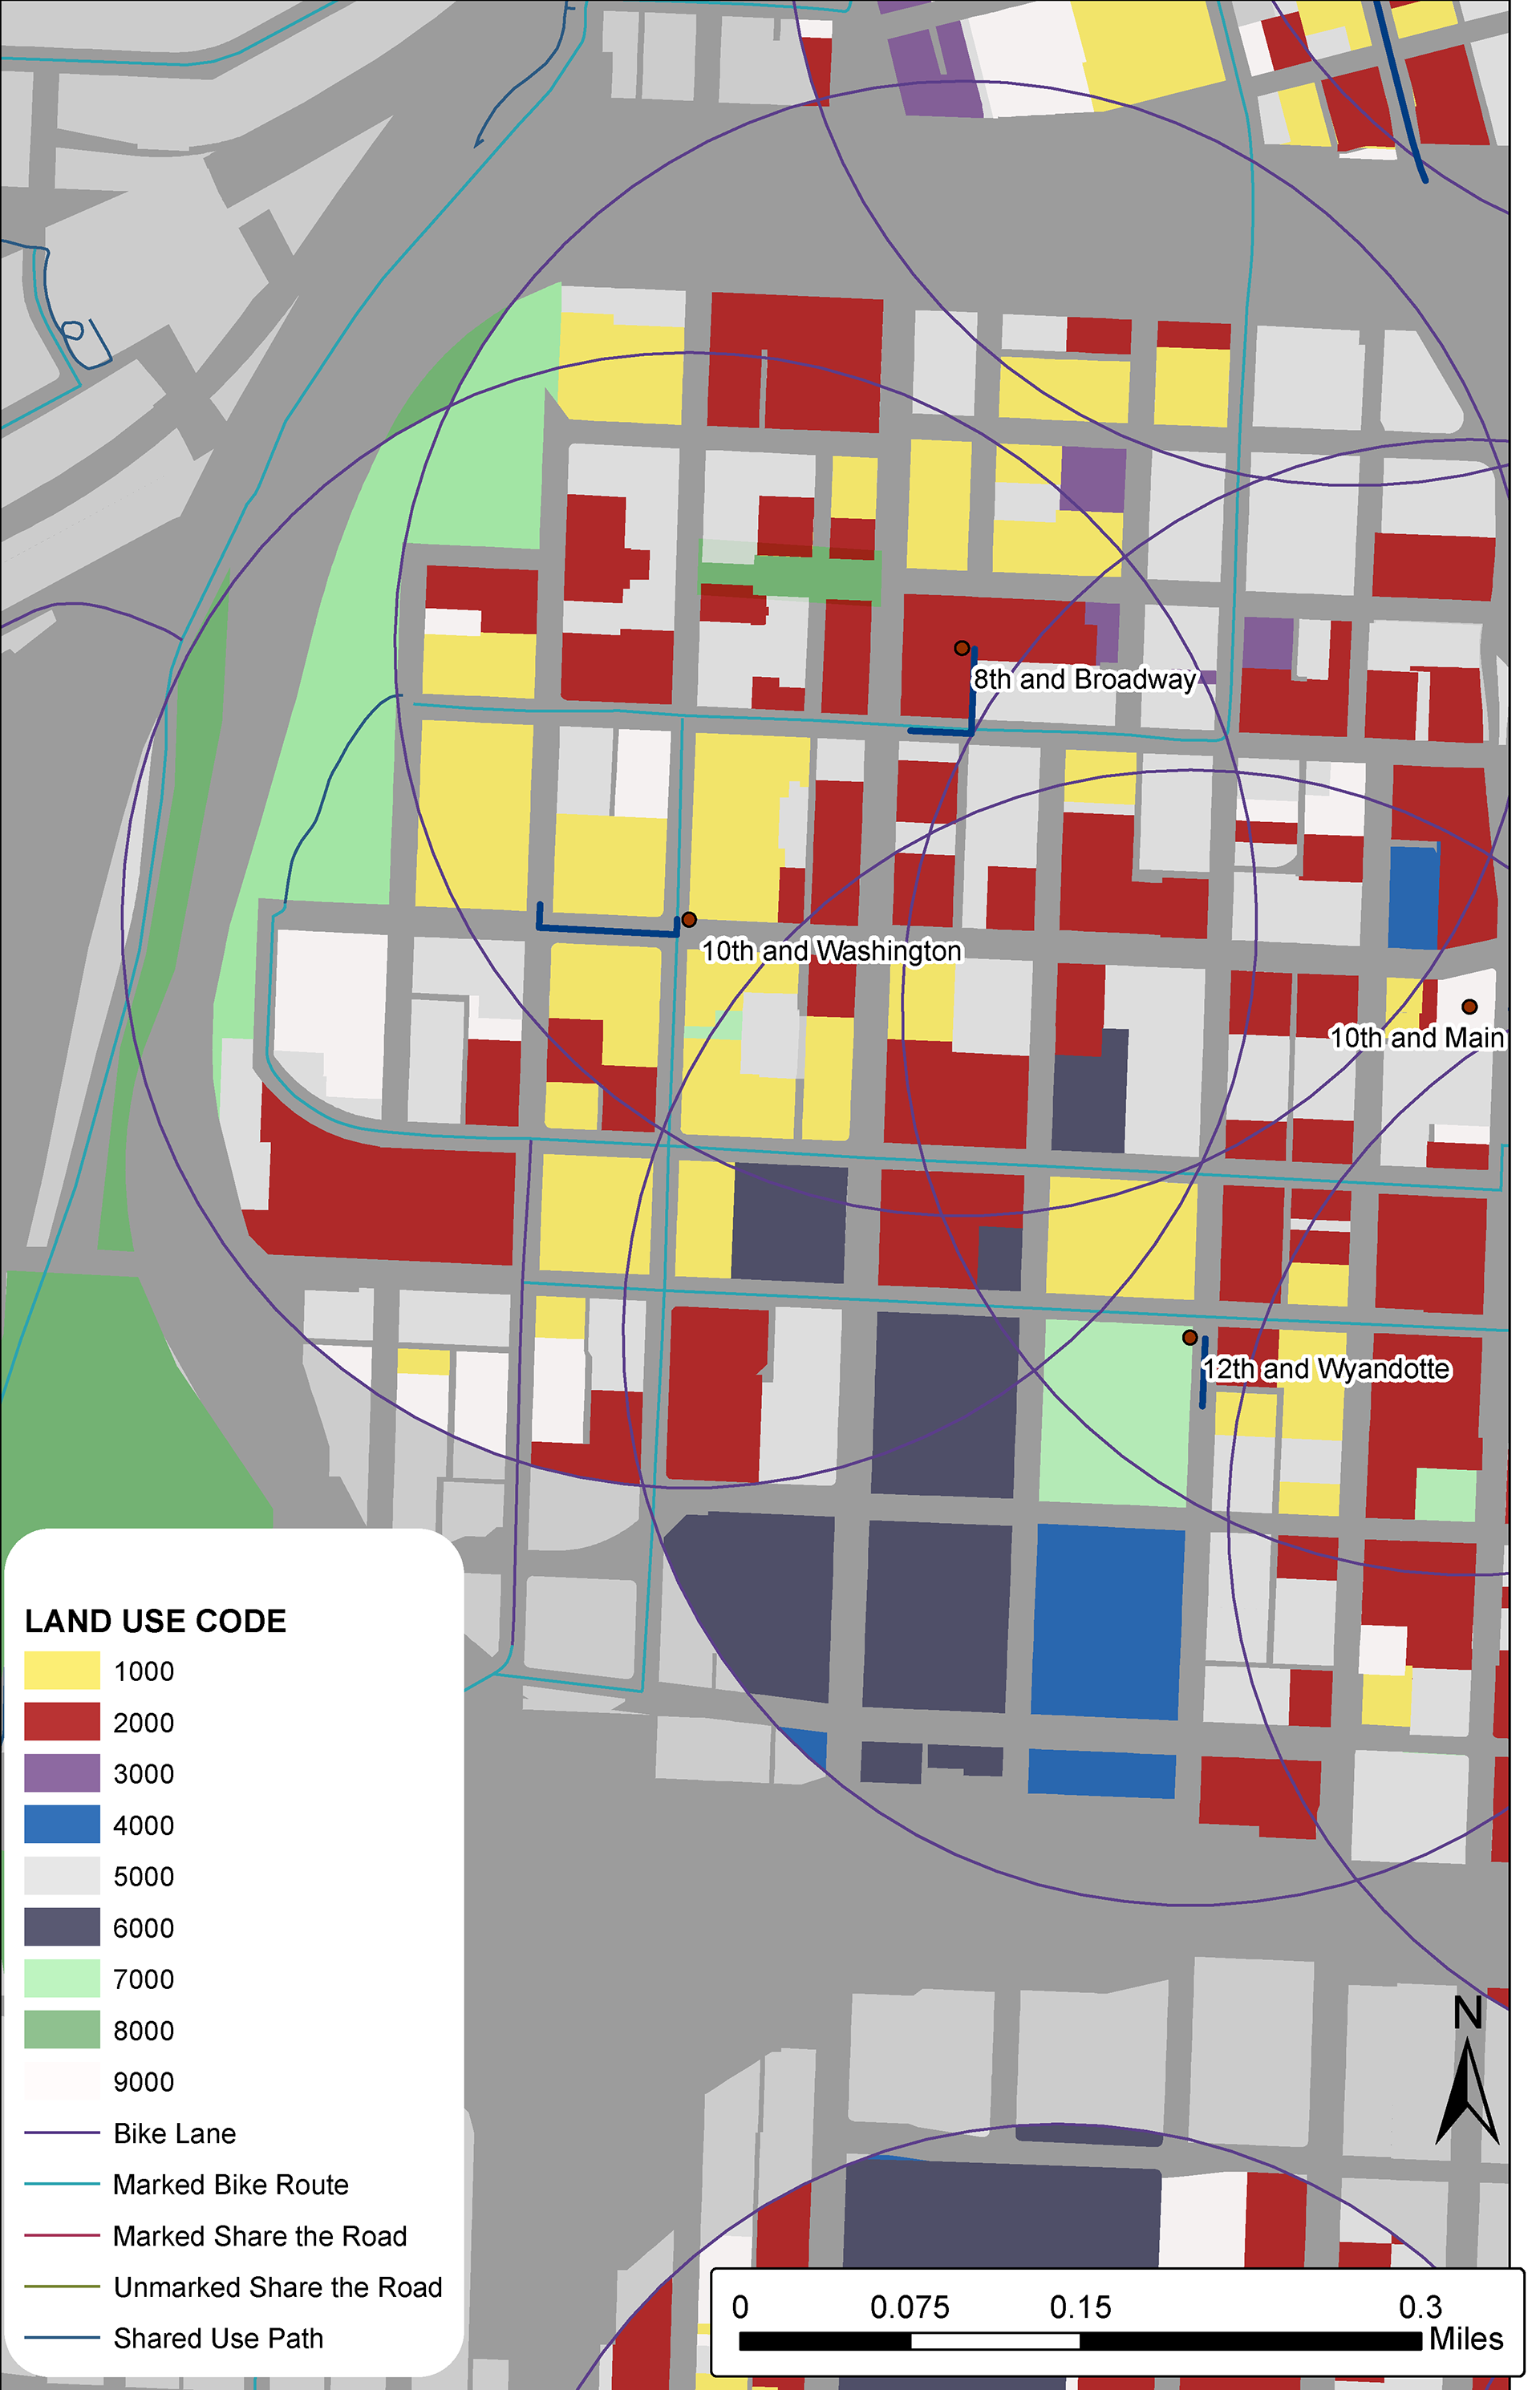
BCycle stations. The number of daily check outs of bike varies considerably per station. The purpose of this study is to compare the built environment surrounding the 5 stations that have the least bikes rented. The goal is to look for possible structural issues (such as a lack of bicycle related facilities
available), the land uses in a 1⁄4 mile surrounding the stations, and other economic and demographic characteristics.
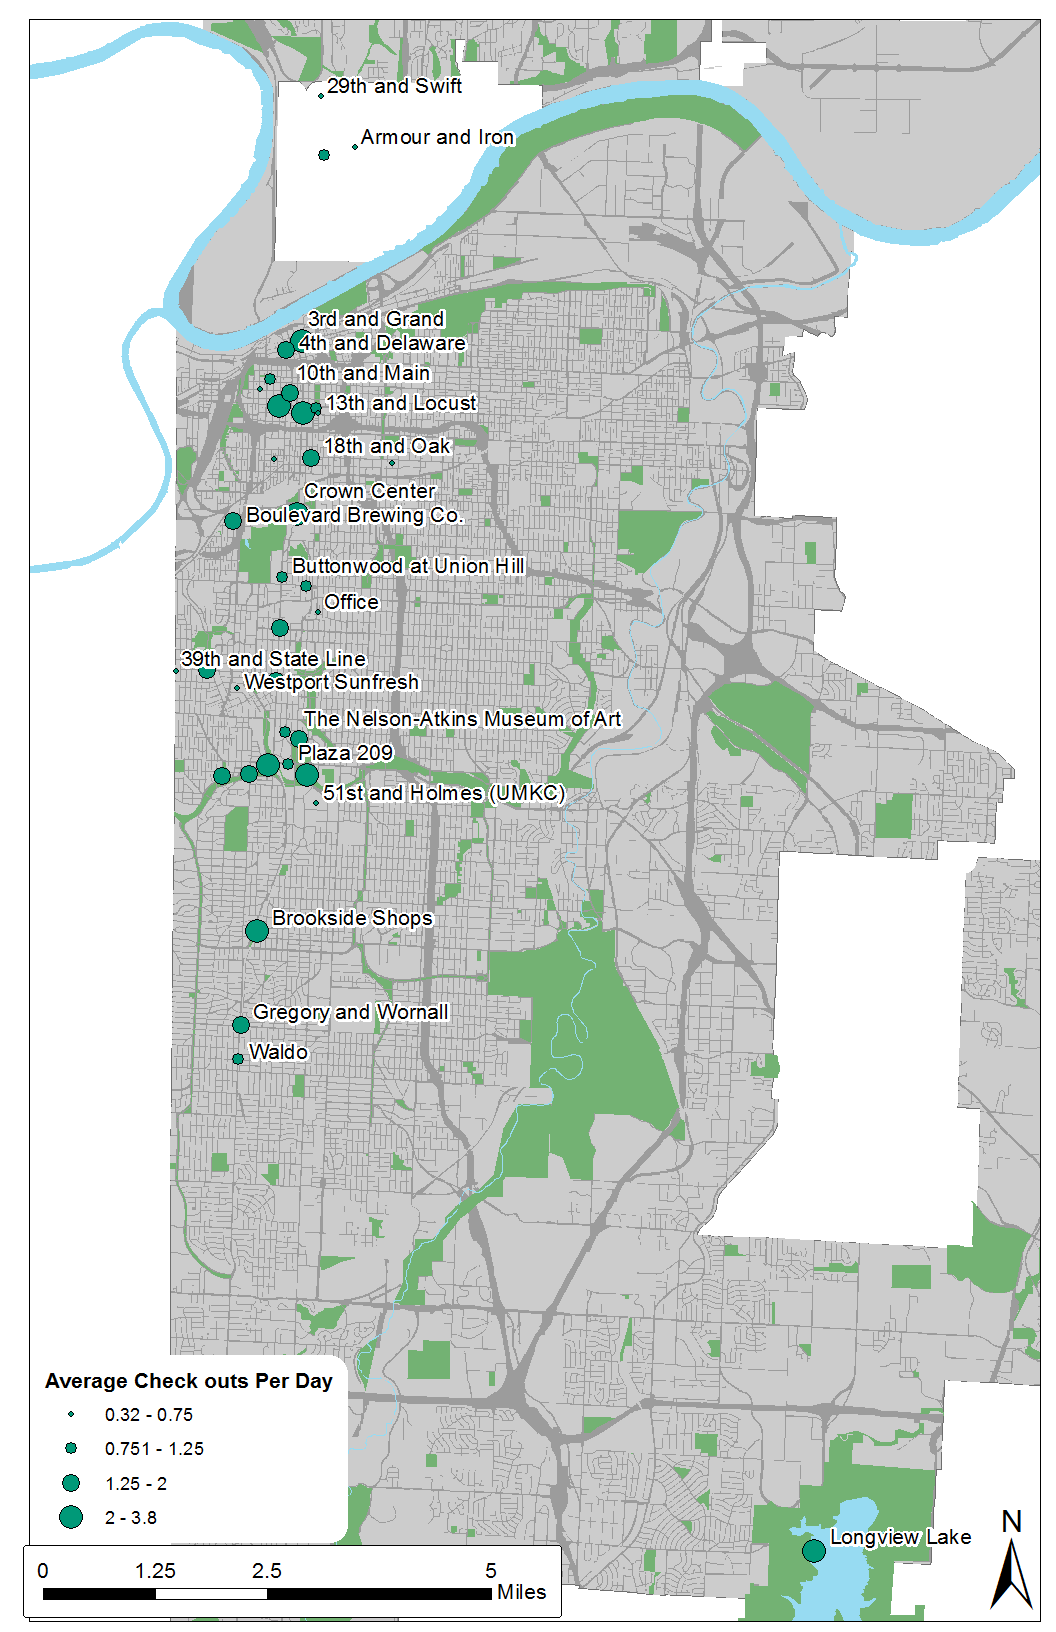
Created a map of the stations, ranked by usage.
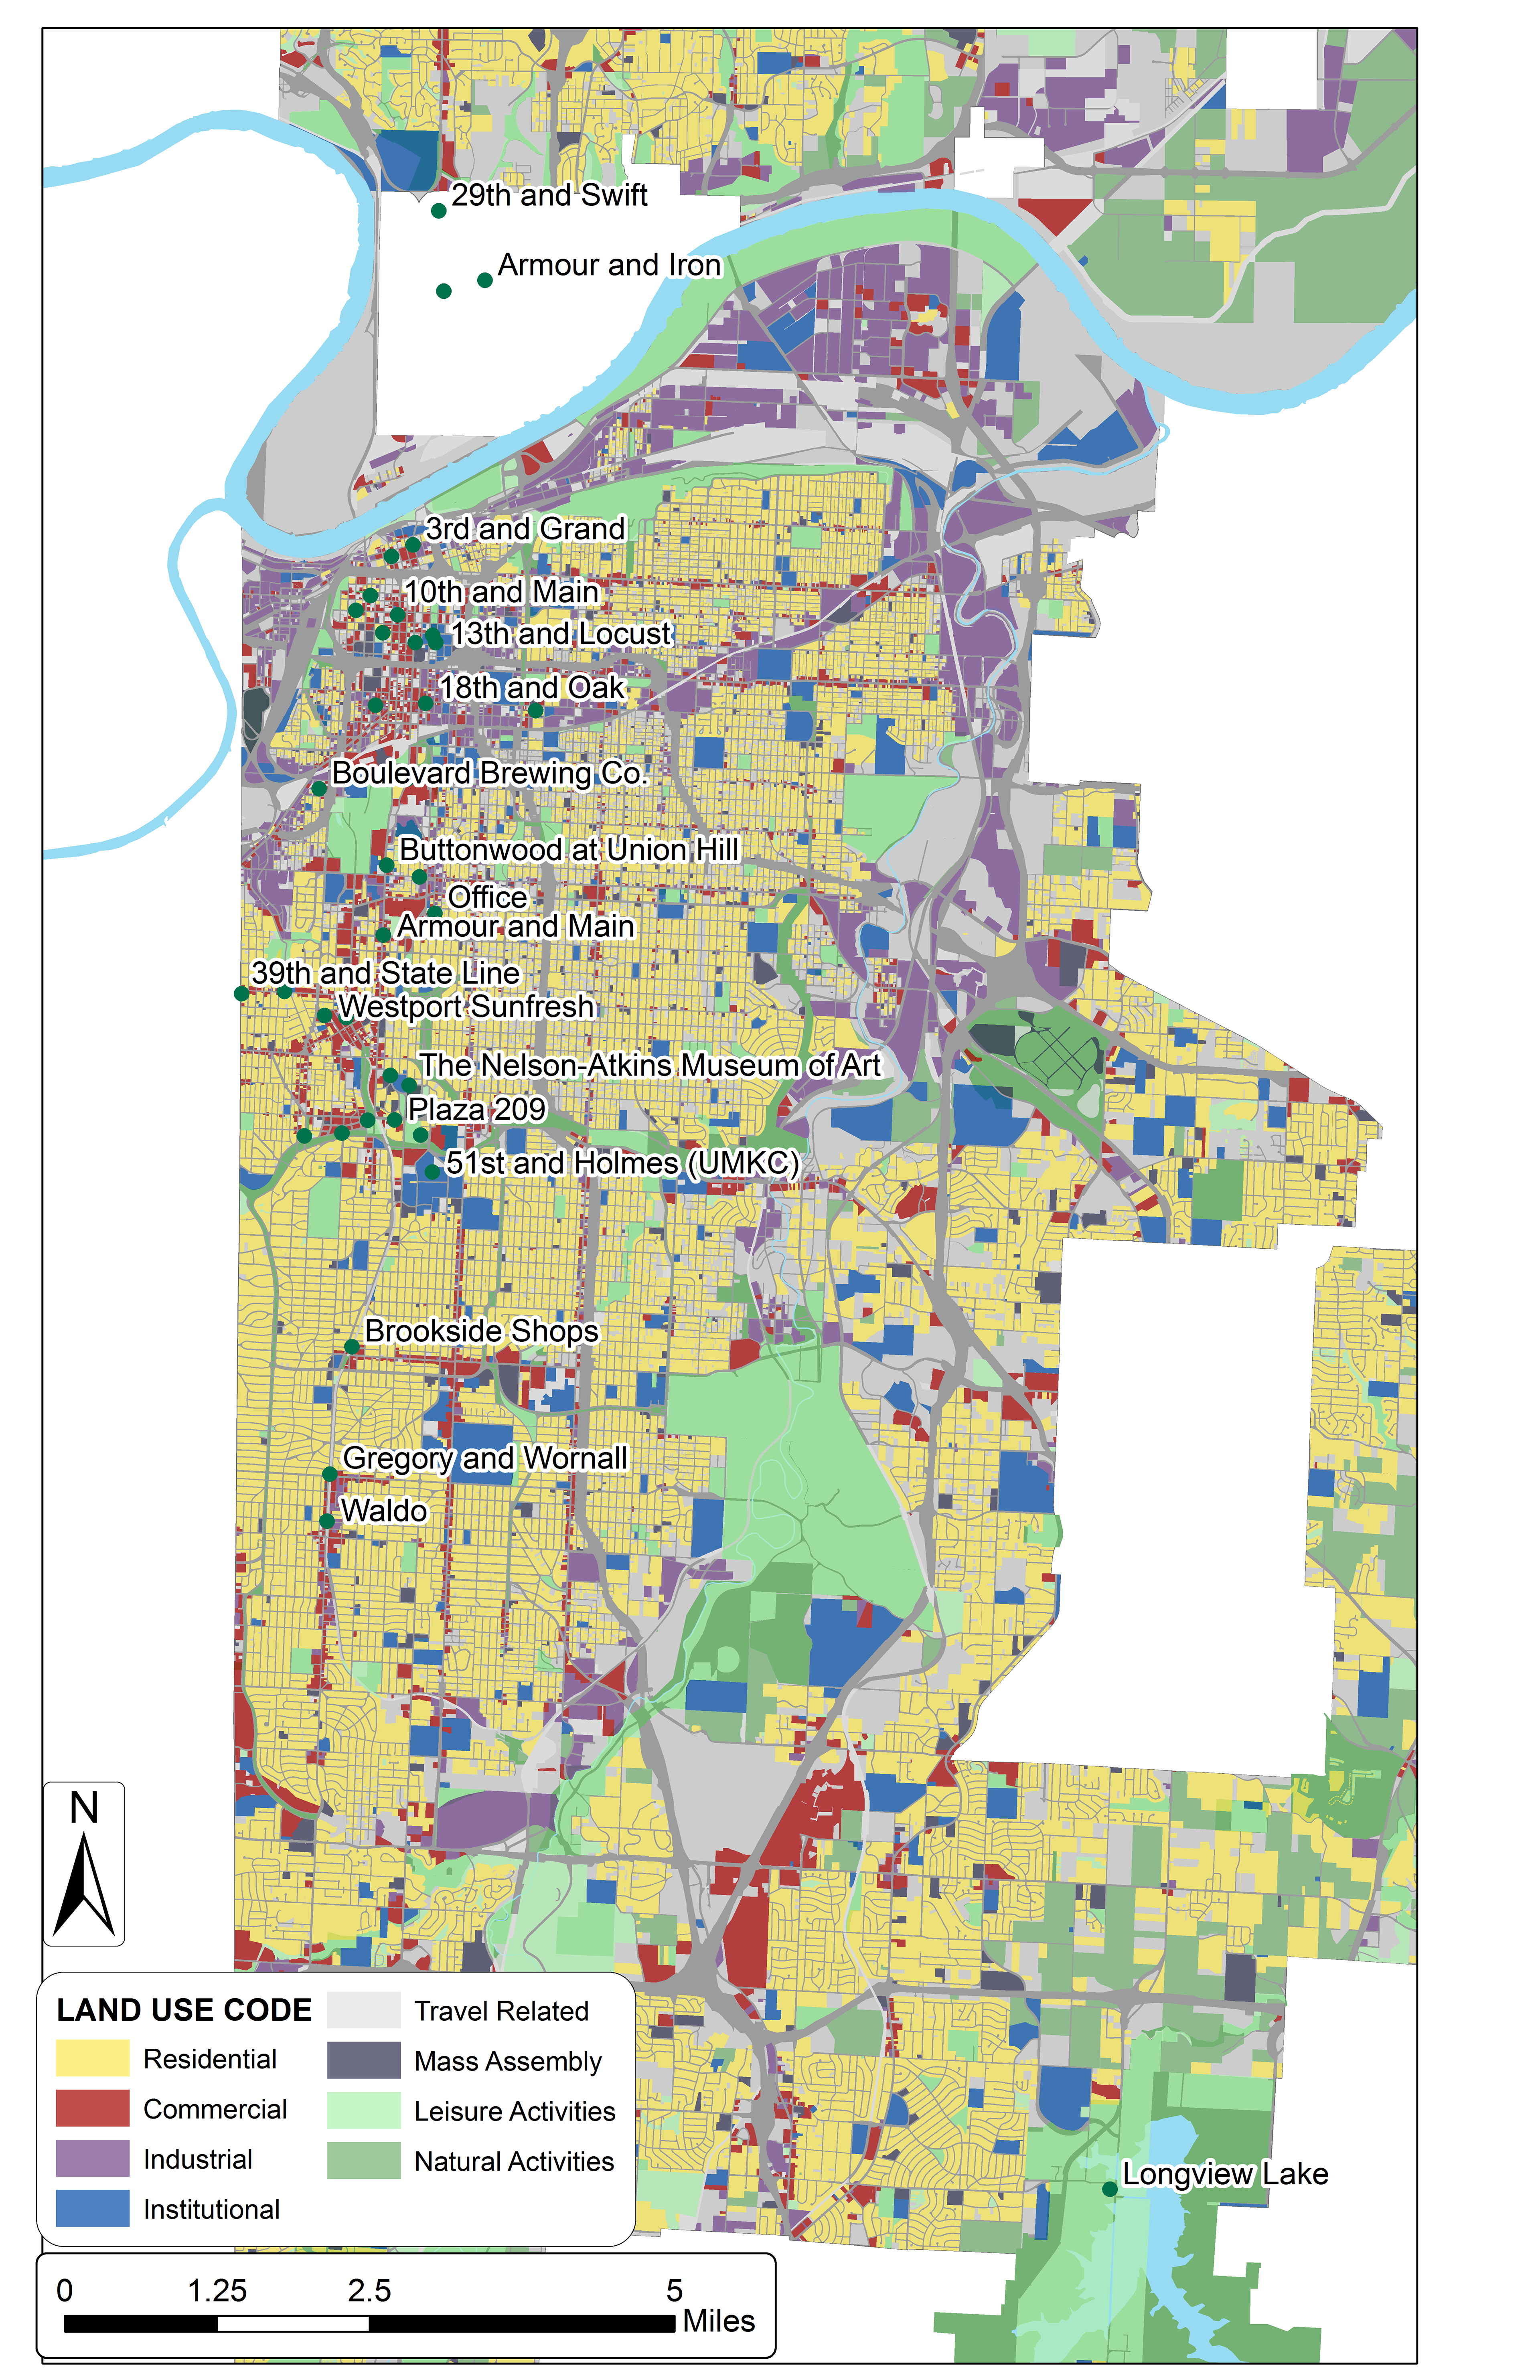
Gathered information about the surrounding Land Uses
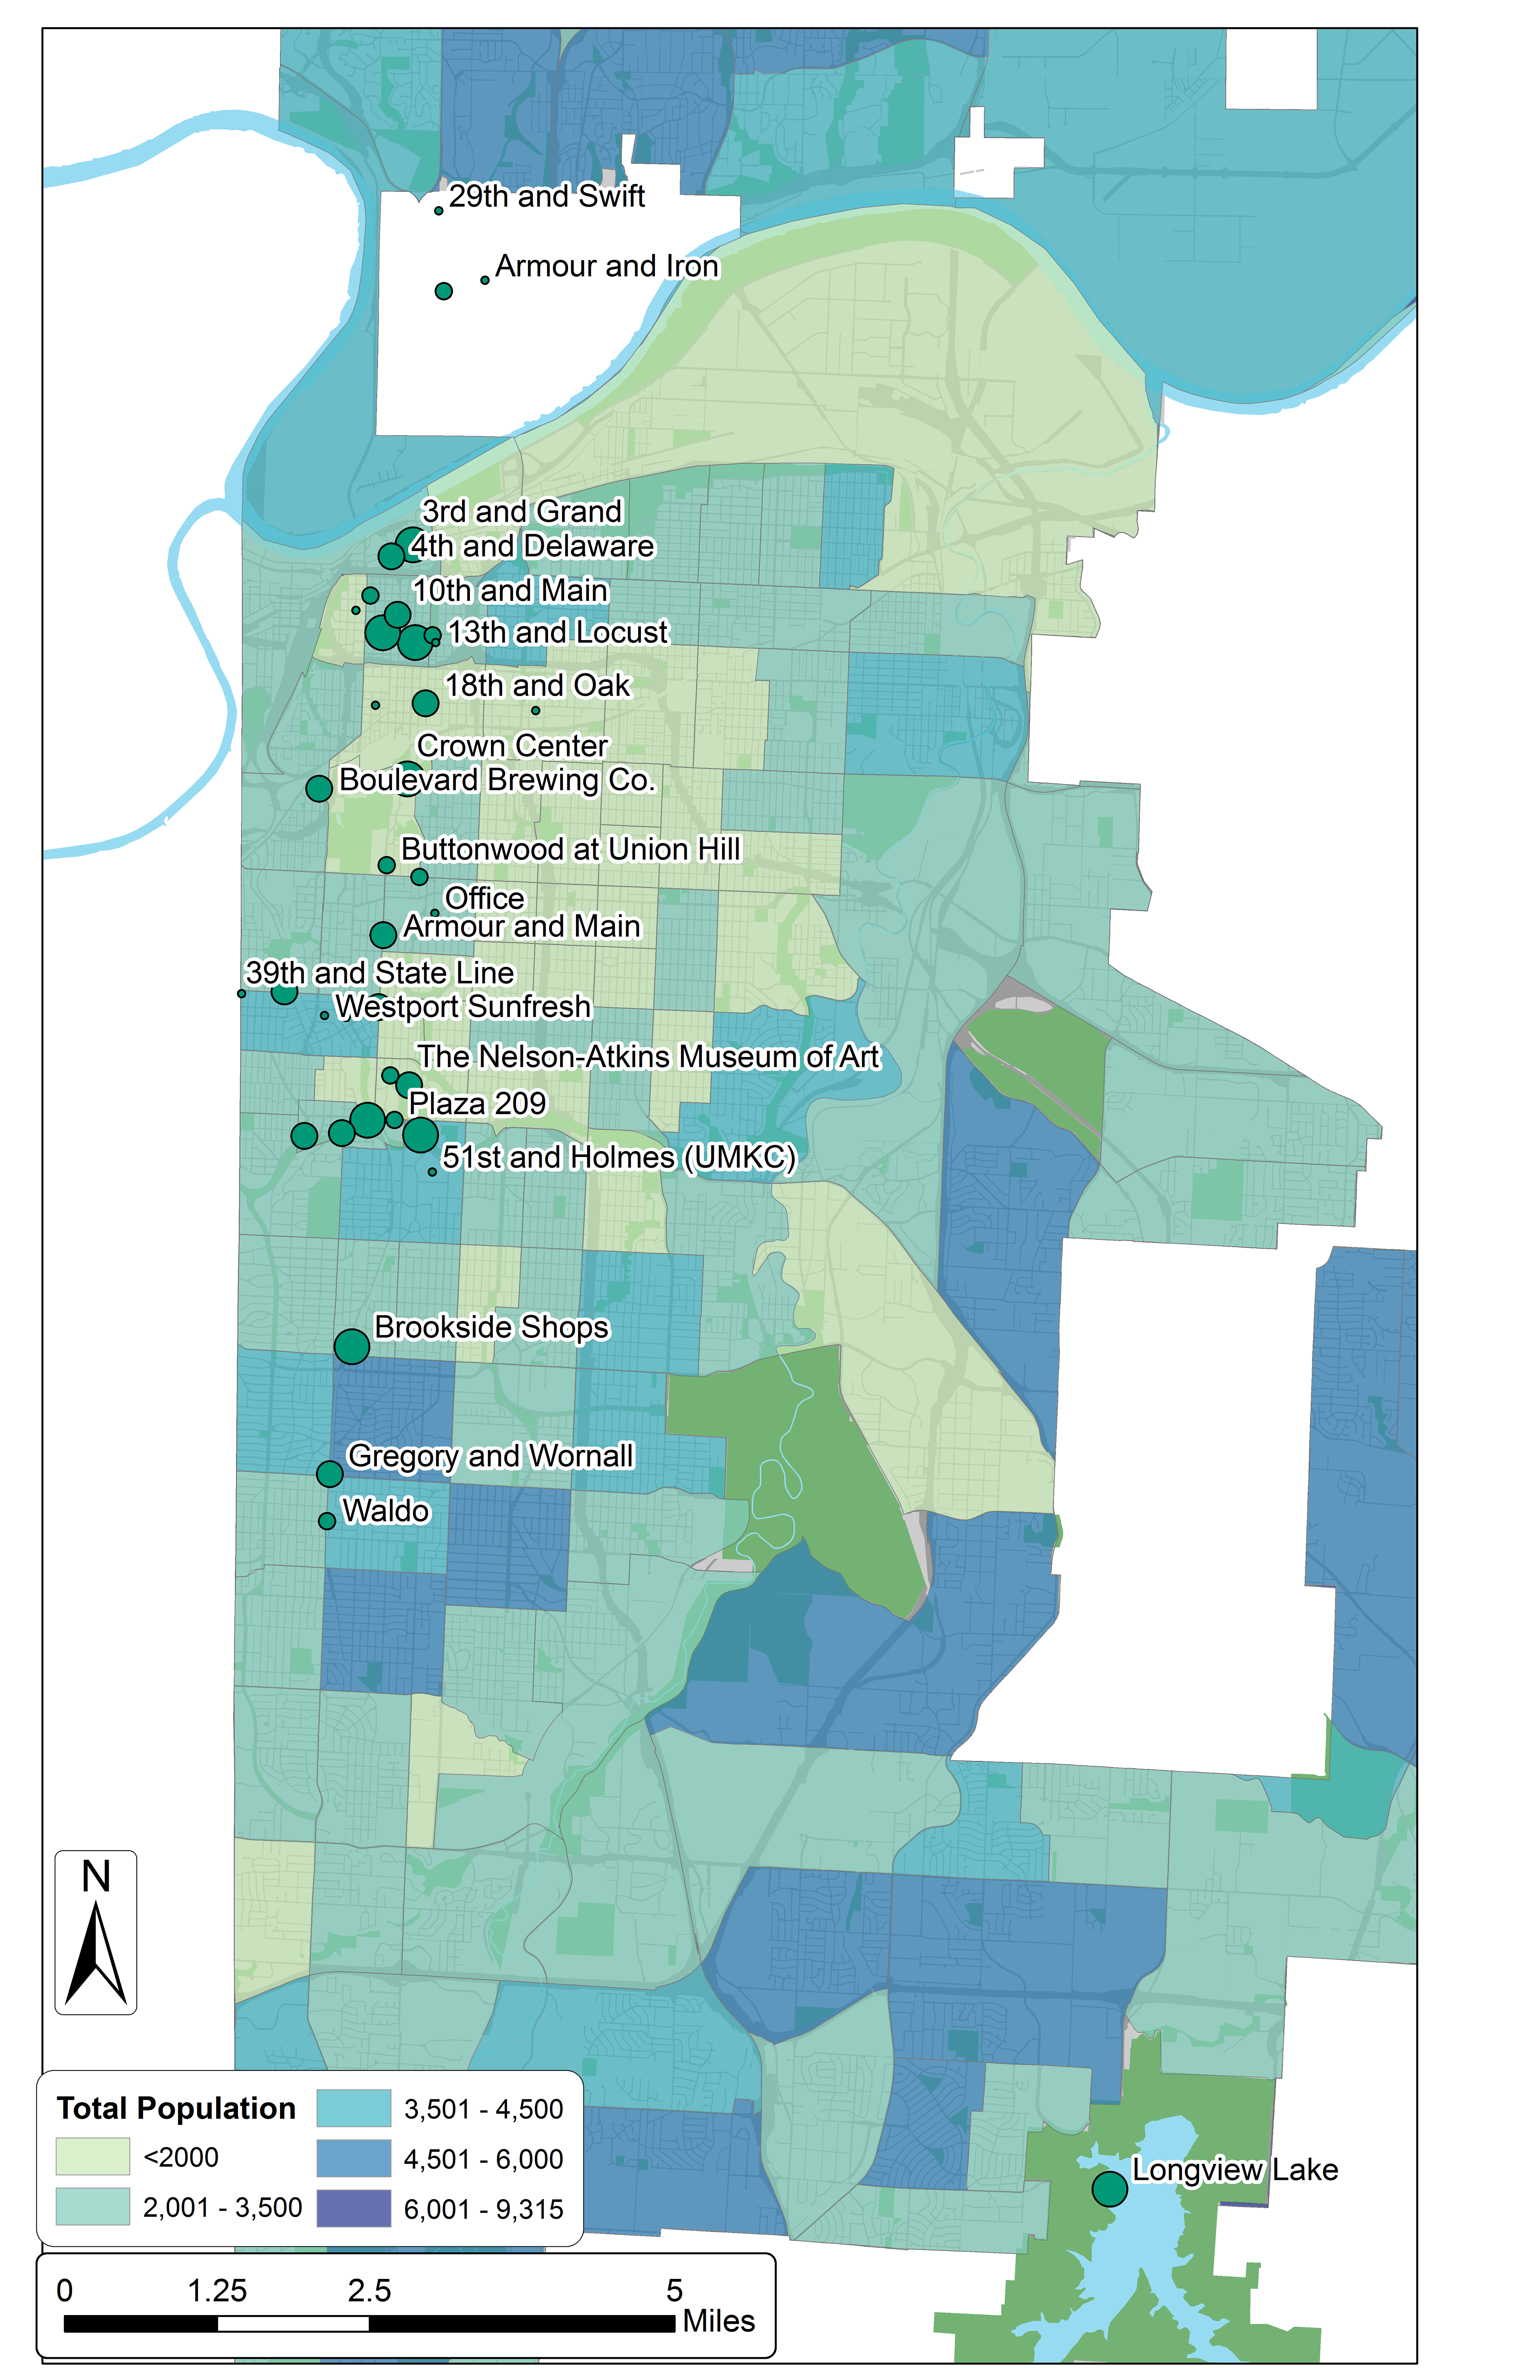
Determined Population Density in relationship with the stations.
Data
The data received from BikeWalkKC showed that the 39th and State Line, Jazz
District (18th and Vine), 51st Street and Holmes (UMKC), Armour and Iron
(North KC), 10th Street and Washington, stations had the lowest number of average checkouts per day. Data was gathered from the KCMO Parcel viewer to determine the surrounding Land Use, and the Census Data was used for economic and demographic information. Data for the Bike lanes and bus stops
was downloaded from the KCMO Open Data website. Maps of the stations
were created using ArcGIS to visualize the data that was collected.
Recommendations
Overall, the goal of the project was to determine why some of the stations were
more successful than others and to see if there was anything that could be
done in the future stations to increase the rider-ship. The area surrounding the
stations was analyzed and patterns were seen.
more successful than others and to see if there was anything that could be
done in the future stations to increase the rider-ship. The area surrounding the
stations was analyzed and patterns were seen.